Sampling Bayesian neural networks
From a posterior distribution to a collection of plausible neural networks.
Placeholder. This note will cover sampling methods and their diagnostics. The short, invented trace below demonstrates article formatting; it is not a sampler run or evidence of convergence.
Equations with multiple lines
Use an aligned environment inside a display-math block to line up related
expressions. Inline notation works the same way as in
Reasoning about neural networks.
$$
\begin{aligned}
\widetilde{\pi}[\theta] &= p[D\mid\theta]p[\theta],\\
U[\theta] &= -\log\widetilde{\pi}[\theta].
\end{aligned}
$$For a symmetric random-walk proposal, the Metropolis acceptance probability is .
A schematic figure
Store diagrams as local SVG files and import them at the top of the MDX file.
Use <figure> and <figcaption> to keep each caption attached to its image.
import samplingFigure from "./sampling.svg";

<figure>
  <img src={samplingFigure.src} width="720" height="240"
    loading="lazy" alt="Current state, proposal, then acceptance or rejection." />
  <figcaption>A rejected proposal retains the current state.</figcaption>
</figure>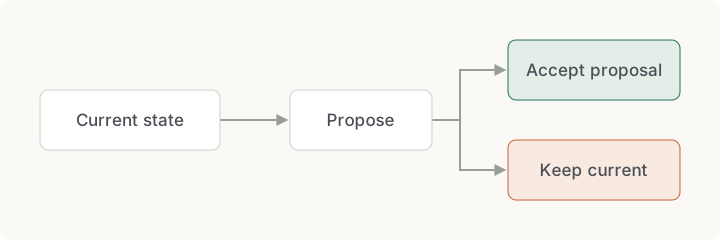
A trace chart
Create a line chart with type: "scatter" and mode: "lines+markers". Keep the
numbers in plain arrays, then pass them to the shared component.
import PlotlyChart from "@site/components/PlotlyChart.astro";

export const traceData = [{
  x: [1, 2, 3, 4, 5], y: [0.3, 0.5, 0.5, 0.8, 1.1],
  type: "scatter", mode: "lines+markers"
}];

<PlotlyChart data={traceData}
  layout={{
    xaxis: { title: { text: "Iteration" } },
    yaxis: { title: { text: "Parameter value" } }
  }}
  config={{ responsive: true, displayModeBar: false }}
  title="An invented parameter trace" />
Interactive chart requires JavaScript.
For a custom interactive experiment, keep its .astro component, browser code,
and numerical tests beside the article, then import that component in MDX.
Load Plotly through @site/lib/plotly.mjs so charts share one library request.
Code blocks
Wrap code in triple backticks and include a language name such as python.
Code is displayed, not executed by the website build.
# An illustrative log-space acceptance decision for a symmetric proposal.
log_acceptance = min(0.0, current_energy - proposed_energy)
if np.log(rng.uniform()) < log_acceptance:
    current = proposal
samples.append(current.copy())  # Keep the current state after rejection, too.
Continue with Samples as a data modality for tables and a heatmap of a small sample matrix.